How can support and resistance zones be drawn effectively? Judging key levels comes down to these three points

The same level has been tested three times—on the fourth time, should you go with it or stay away?
In trading, many people have encountered a similar situation: the same support zone, price has already come back to touch it three times, and each time it held and bounced. Now the fourth time has arrived—follow or not?
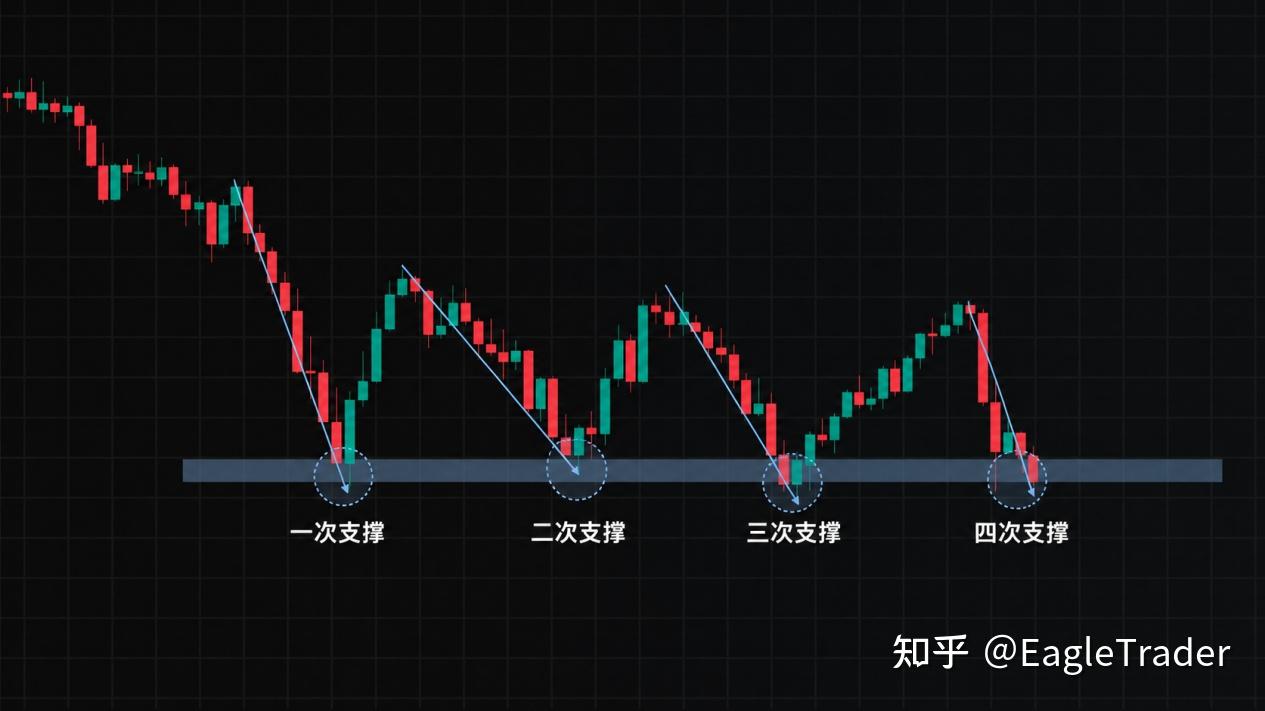
There is often debate about this in trading circles. Some say the more tests, the stronger the support, so on the fourth time just go long with your eyes closed; others say the buying interest has long been exhausted, and once the fourth test breaks, price will plummet.
Looking back at a large number of trading cases, you’ll find that both outcomes really do exist. So where exactly is the problem?
The answer is not complicated: the number of tests itself is not the key. The key is whether the level you have marked is truly a “key support zone.”
What you drew is not a support level—it’s psychological comfort.
When many people draw support and resistance levels, they are used to drawing a line precise to four decimal places. Price touches the line and bounces—so the drawing is indeed accurate; price breaks below it a little and they stop out, only for it to immediately pull back—getting washed out again.
The problem is that in real price action there is no precise price at which all traders will make the same decision at the same time.
Some will enter early, some will wait for price to go a little deeper, and others will wait for a confirmation signal before acting. These decisions are reflected in the market as price pausing and turning repeatedly within a range, rather than precisely hitting the same point every time.
The more precise the lines you draw, the more easily they are disrupted by normal fluctuations. A slight break below is taken as “support failure,” and when price pulls back it is called a “false breakout”—getting slapped in the face repeatedly is not because the market is cunning, but because your understanding of support itself is off.
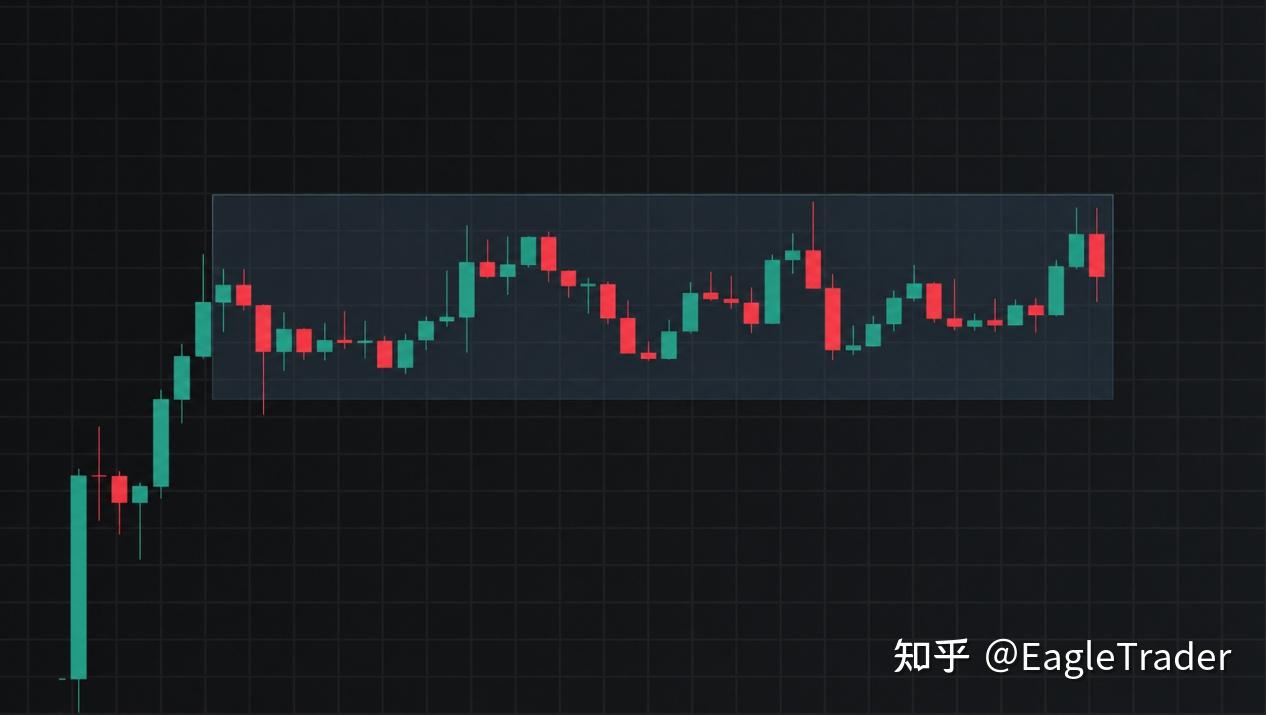
A more reasonable approach is: frame the range where price repeatedly produces important changes as a zone that requires focused observation. A support level is not a line, but a zone where “once price reaches here, the market begins to deserve attention.”
What kind of level is worth spending time observing?
Once the zone is drawn correctly, the next step is to judge whether this zone has real reference value. You can start from three dimensions.
First, the number of effective touches must be sufficient.
What is emphasized here is “effective touch,” not “touched many times.” If price keeps sticking within the same zone, with several candlesticks moving back and forth through it, it may look like it touched seven or eight times, but in reality it can only count as one test. Only when price first clearly leaves the zone and then comes back again does it count as a new independent touch.
The more such independent touches there are, the more it shows that the market has paid attention to the same price range at different times, and the zone’s reference value is naturally higher.
Second, whether a clear reaction occurred after the touch.
It is not about whether price fluctuates strongly within this zone; it is about whether it can clearly change the original state of price movement. For example, if price was originally falling continuously, then after reaching this zone it clearly turns upward and moves away for some distance—that is what counts as an effective reaction. If the decline merely slows, grinds through a few candlesticks, and then continues falling, then the weight of this level is limited.
Third, whether support and resistance have swapped roles.
A level originally kept suppressing price, with price pulling back every time it reached there—that is resistance. Later, price breaks above it, then retests the same range and starts rising from there again—the original resistance becomes support. The reverse is also true.
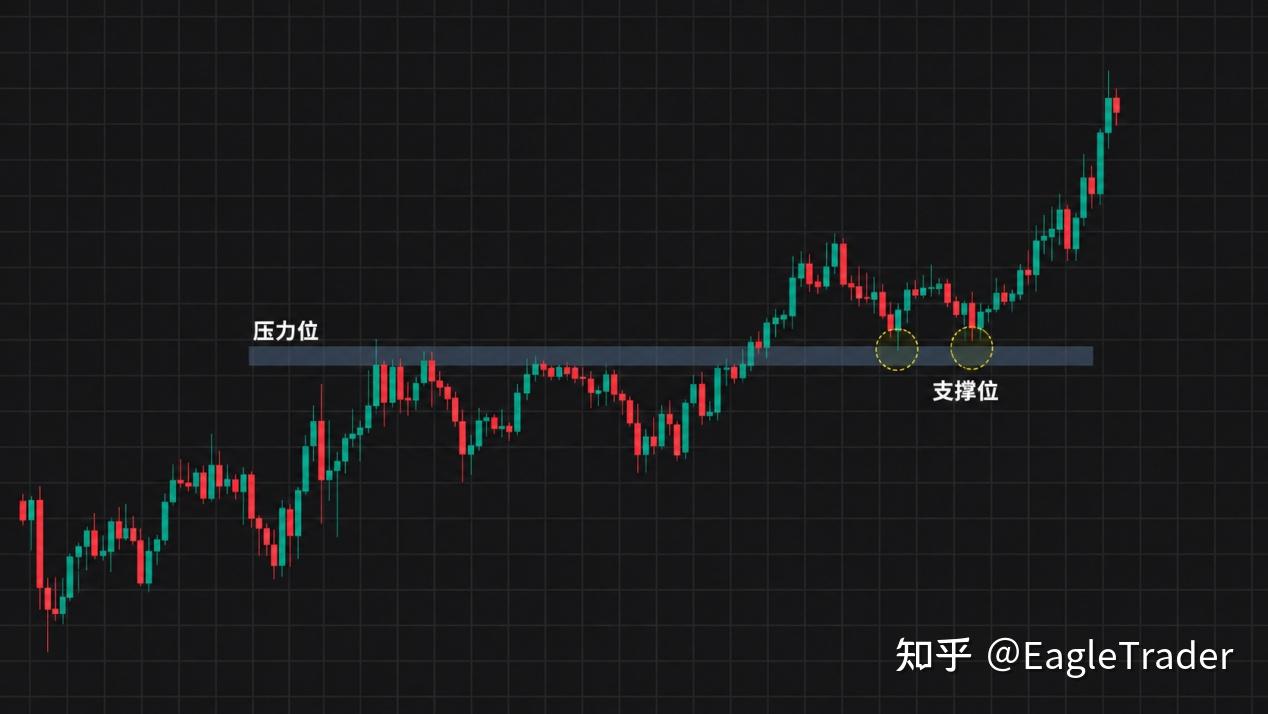
If a zone has served as both support and resistance, it shows that both bulls and bears have truly fought here. The reference value of such a level is far higher than that of a place where price bounced only once.
Recognition ability requires repeated training.
These three standards are not hard to understand; what is hard is being able to quickly identify them when you open an unfamiliar chart.
Which touches count as effective tests? Which zone has produced a strong reaction? Where has support-resistance role reversal been completed? These questions cannot be answered well by merely reading a few articles or being familiar with one or two cases; you must form judgment habits through extensive practice.
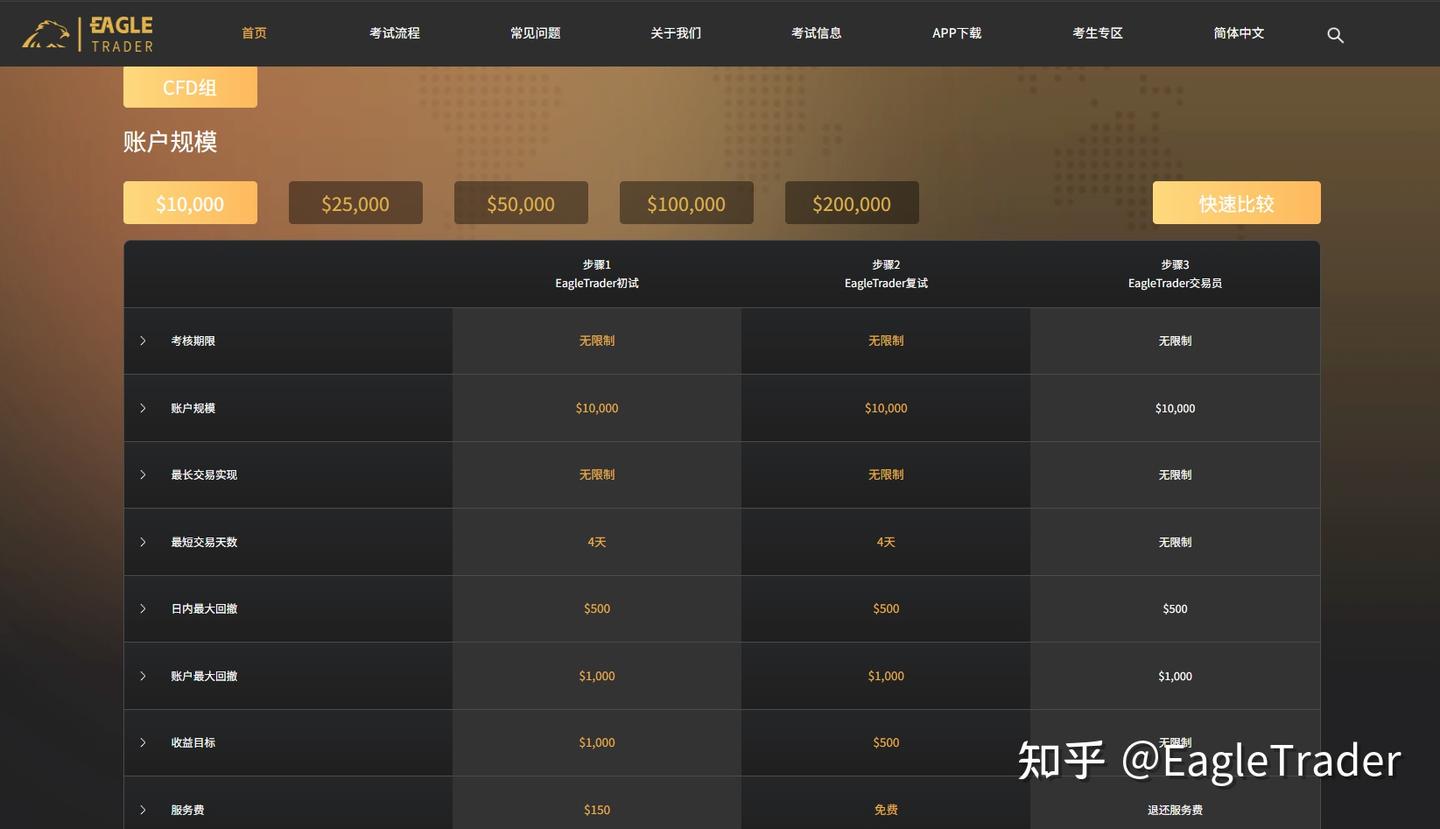
For traders, a simulated environment is a suitable setting for training this kind of recognition ability. Take EagleTrader proprietary trading as an example: its simulated capital reproduces real market conditions 1:1, and traders do not need to bear the pressure of real losses, so they can repeatedly verify the same set of judgment standards across different instruments and different time frames.
The practice method is not complicated: select historical price action, first frame the key zones yourself, then scroll forward to see how price actually performed after reaching these zones. Summarize the experience when your judgment is correct, and analyze the reasons when it is wrong. With enough practice, when you open a chart, you can often identify at a glance which zones are worth watching.
In addition, EagleTrader itself has clear risk control rules, which can help traders develop the habits of trading with light positions and setting stop losses, avoiding arbitrary heavy positions because there is no pressure in a simulated environment, and ensuring that both skills and discipline improve together.
Support is not a prediction; it is the starting point for observation.
Back to the original question: if the same support zone has been tested three times, should you follow on the fourth?
If these three times are all relatively independent effective touches, price has produced a clear reaction here, and support-resistance role reversal has also occurred—then the more tests there are, the more this zone deserves attention.
But “worth watching” does not equal “will definitely bounce.” The role of a support/resistance zone is not to let people guess the exact low and high, nor to prove how precise the drawn lines are, and even less to let people ignore the trend and buy the bottom just because they see support.
Its real meaning is to remind you: after price reaches this range, the market deserves serious observation. As for whether to follow and how to follow, you still need to combine the trend, signals, and your own trading system to make a decision.
There is no once-and-for-all answer in trading, only methods that are continuously verified. And the best way to verify is to keep practicing in a low-pressure, repeatable environment.
Ready to take on EagleTrader Max?
No upfront evaluation stage. Trade immediately once funded, with up to 90% profit split.